Tracking Usage Across Your Organisation
Last updated: August 5, 2026
The Organisation Analytics page gives Admins and Supervisors a single place to see how your team is using AdvisoryAI, split across three subtabs: Reports, Activity, and Members.
Keeping an eye on usage helps in a few practical ways:
Shows which team members are getting real value from the platform, and which might need a nudge
Enables you to track the number of meetings advisors have, and the types of reports paraplanners are using the platform to create
Surfaces CRM integration issues early — a user syncing zero updates when they should be syncing daily is usually the first sign there is an issue
Getting to Organisation Analytics
Click the cog icon in the bottom left of the platform
Select Tools and Settings
Select Organisation
Select Organisation Analytics
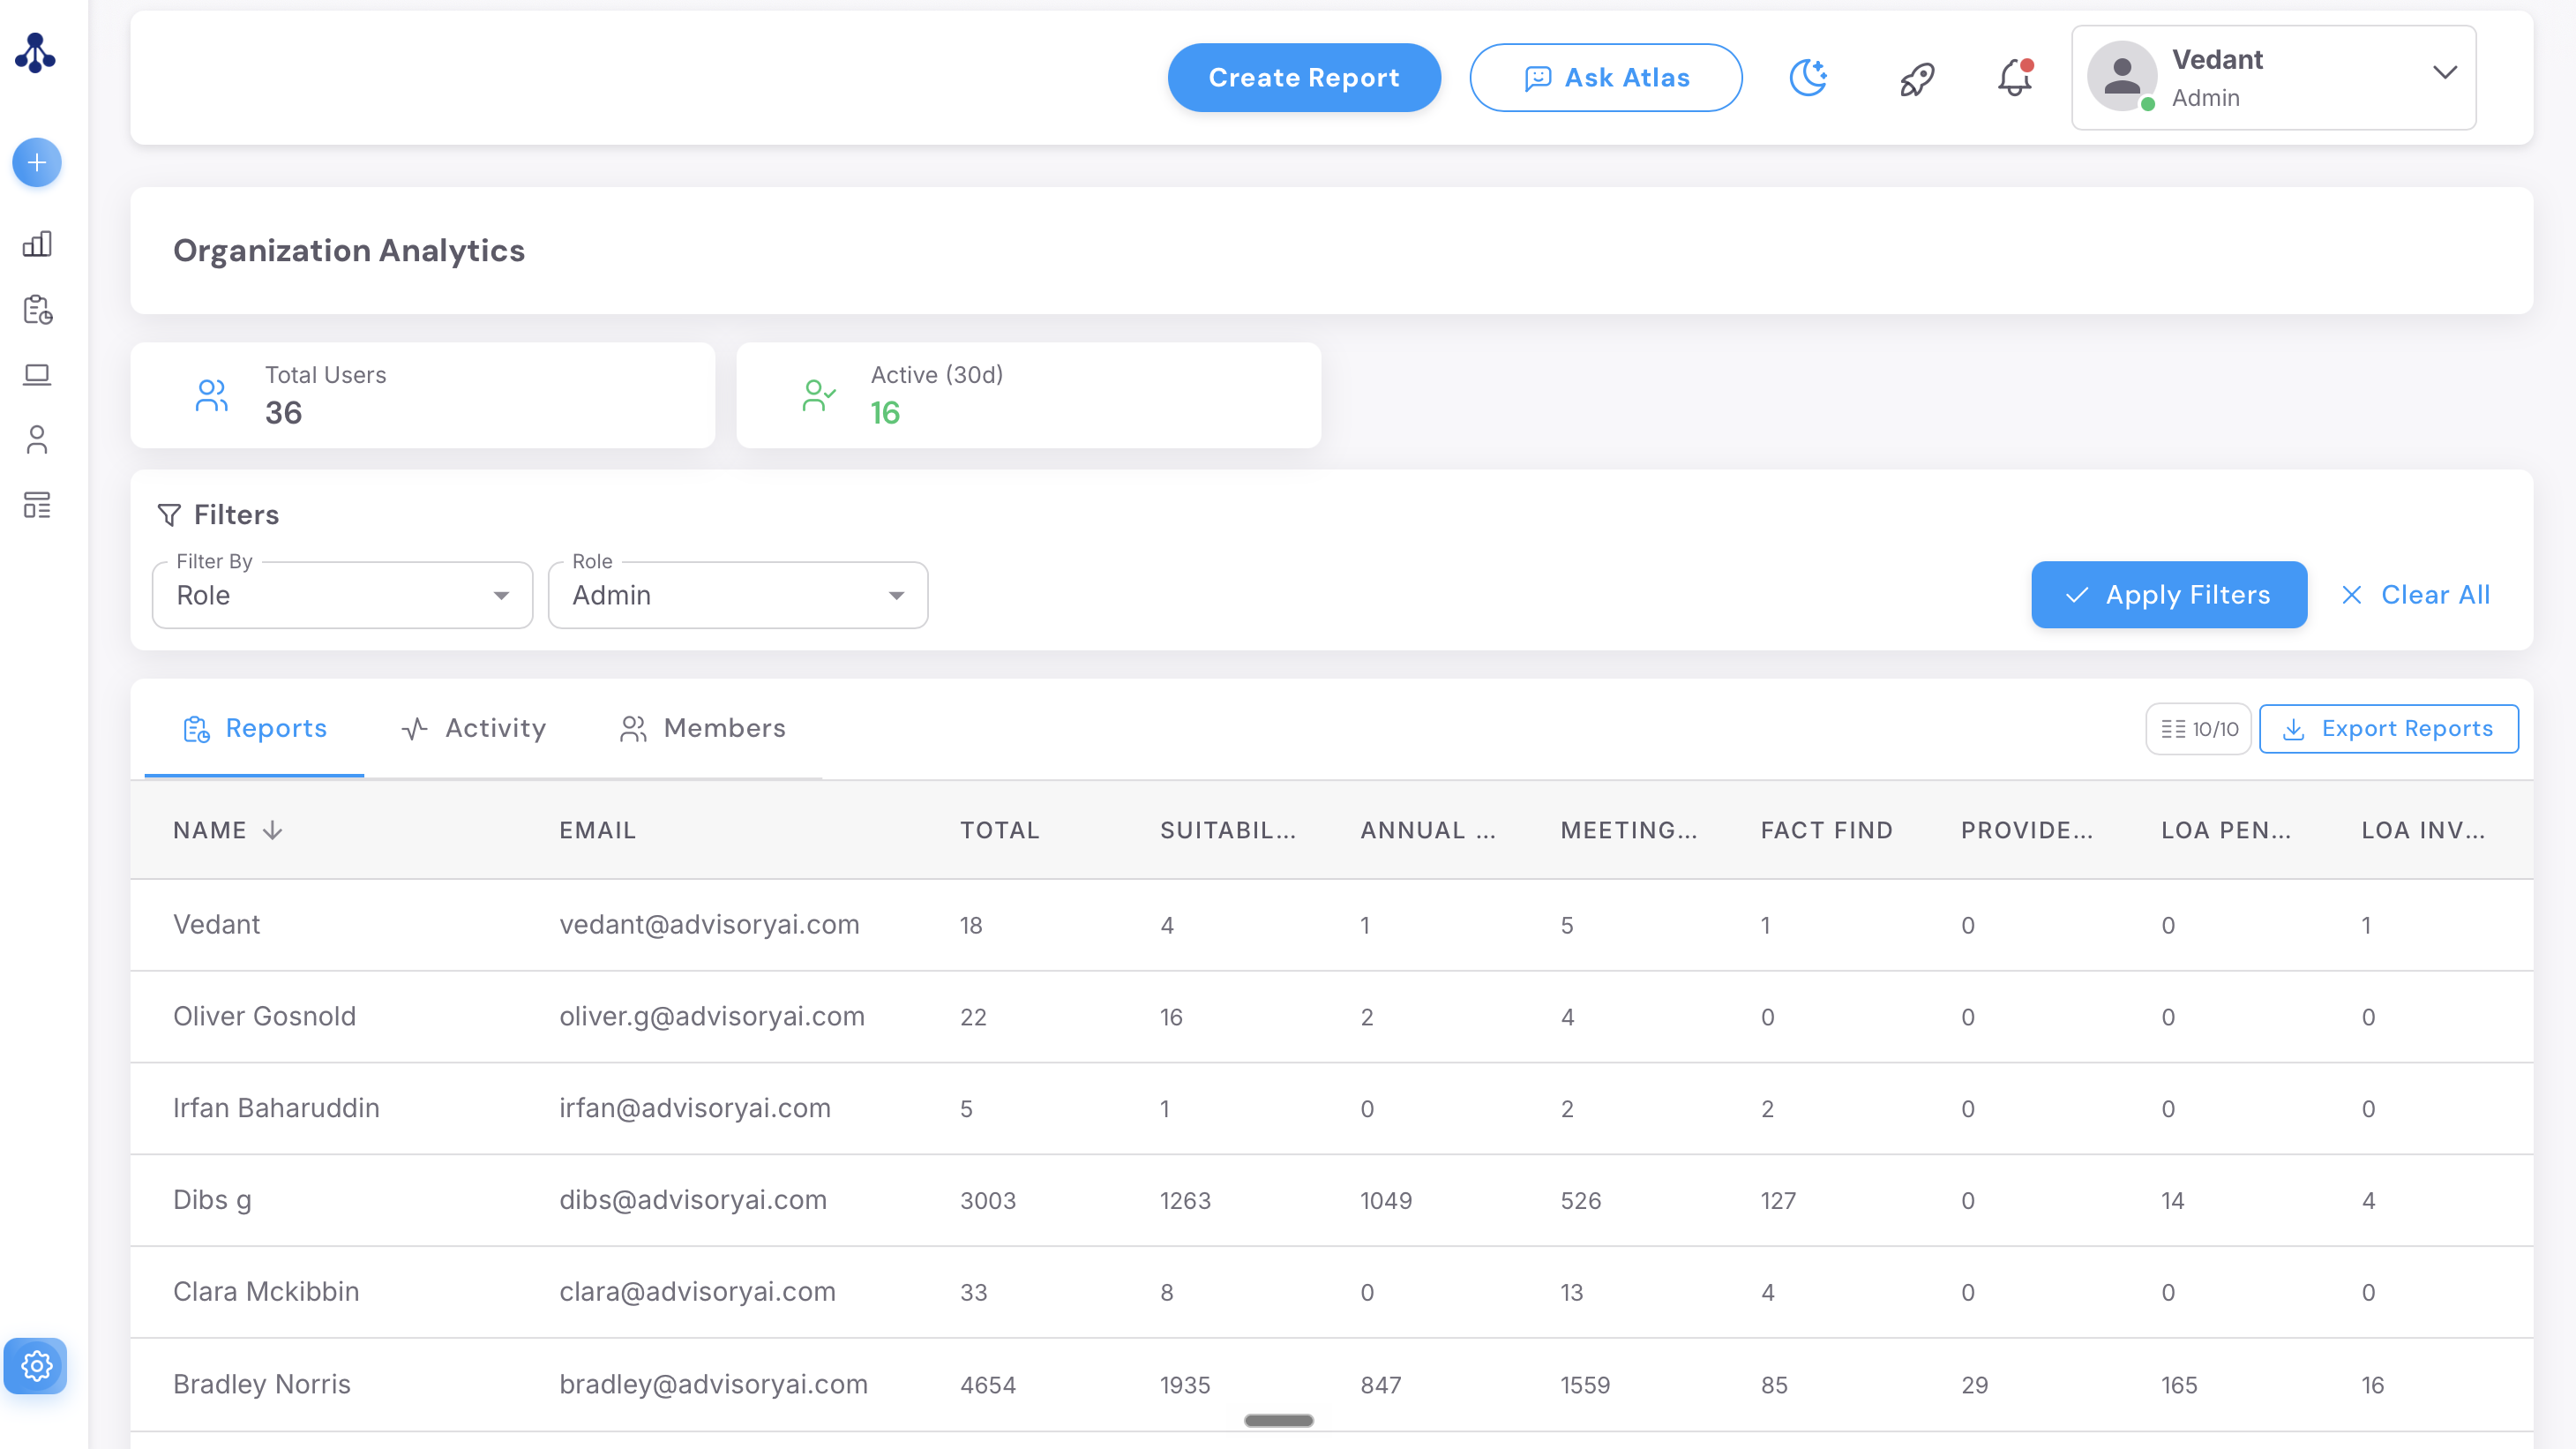
Reports
Tells you who's actually producing reports on the platform, and what kind.
Total reports created per user
Breakdown by report type: Suitability Letters, Annual Reviews, Meeting Notes, Fact Finds, Provider Info, and LOA summaries by asset class
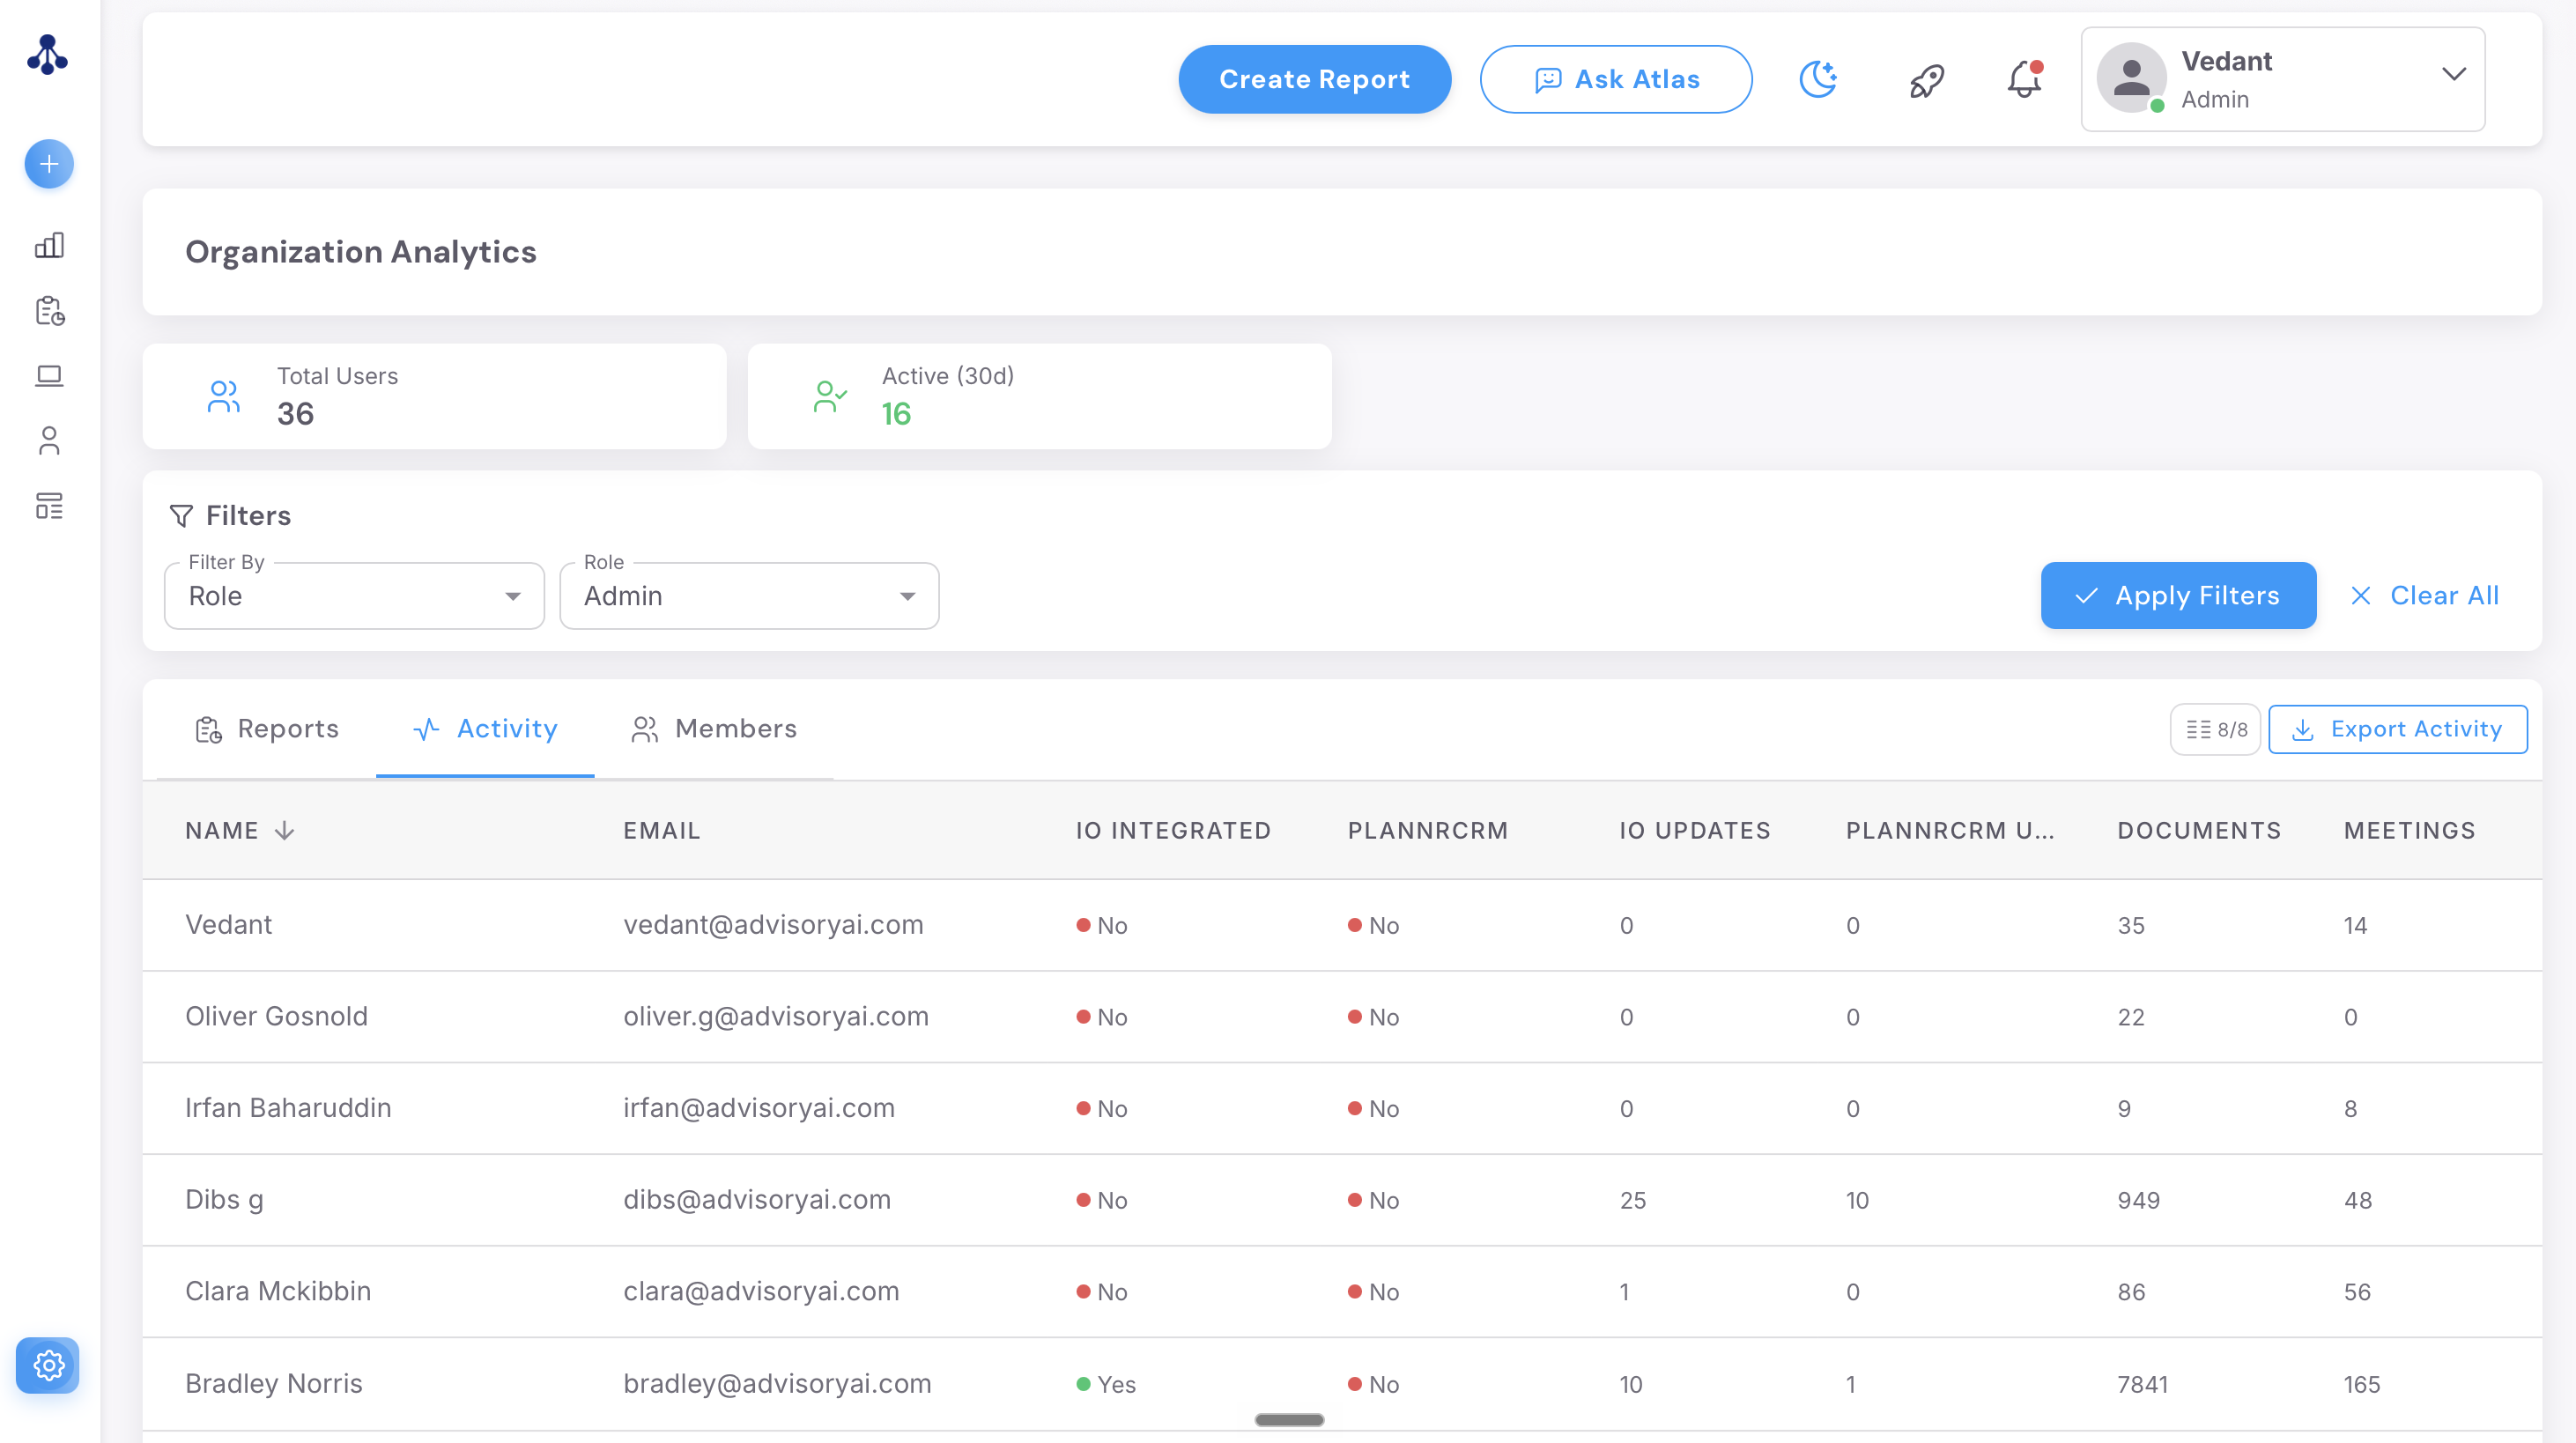
Activity
Tells you how healthy your users CRM integrations are with the platform
Whether each user is connected to Intelliflo (IO) or PlannrCRM
How many updates have synced from each
Tracks overall document and meeting counts per user
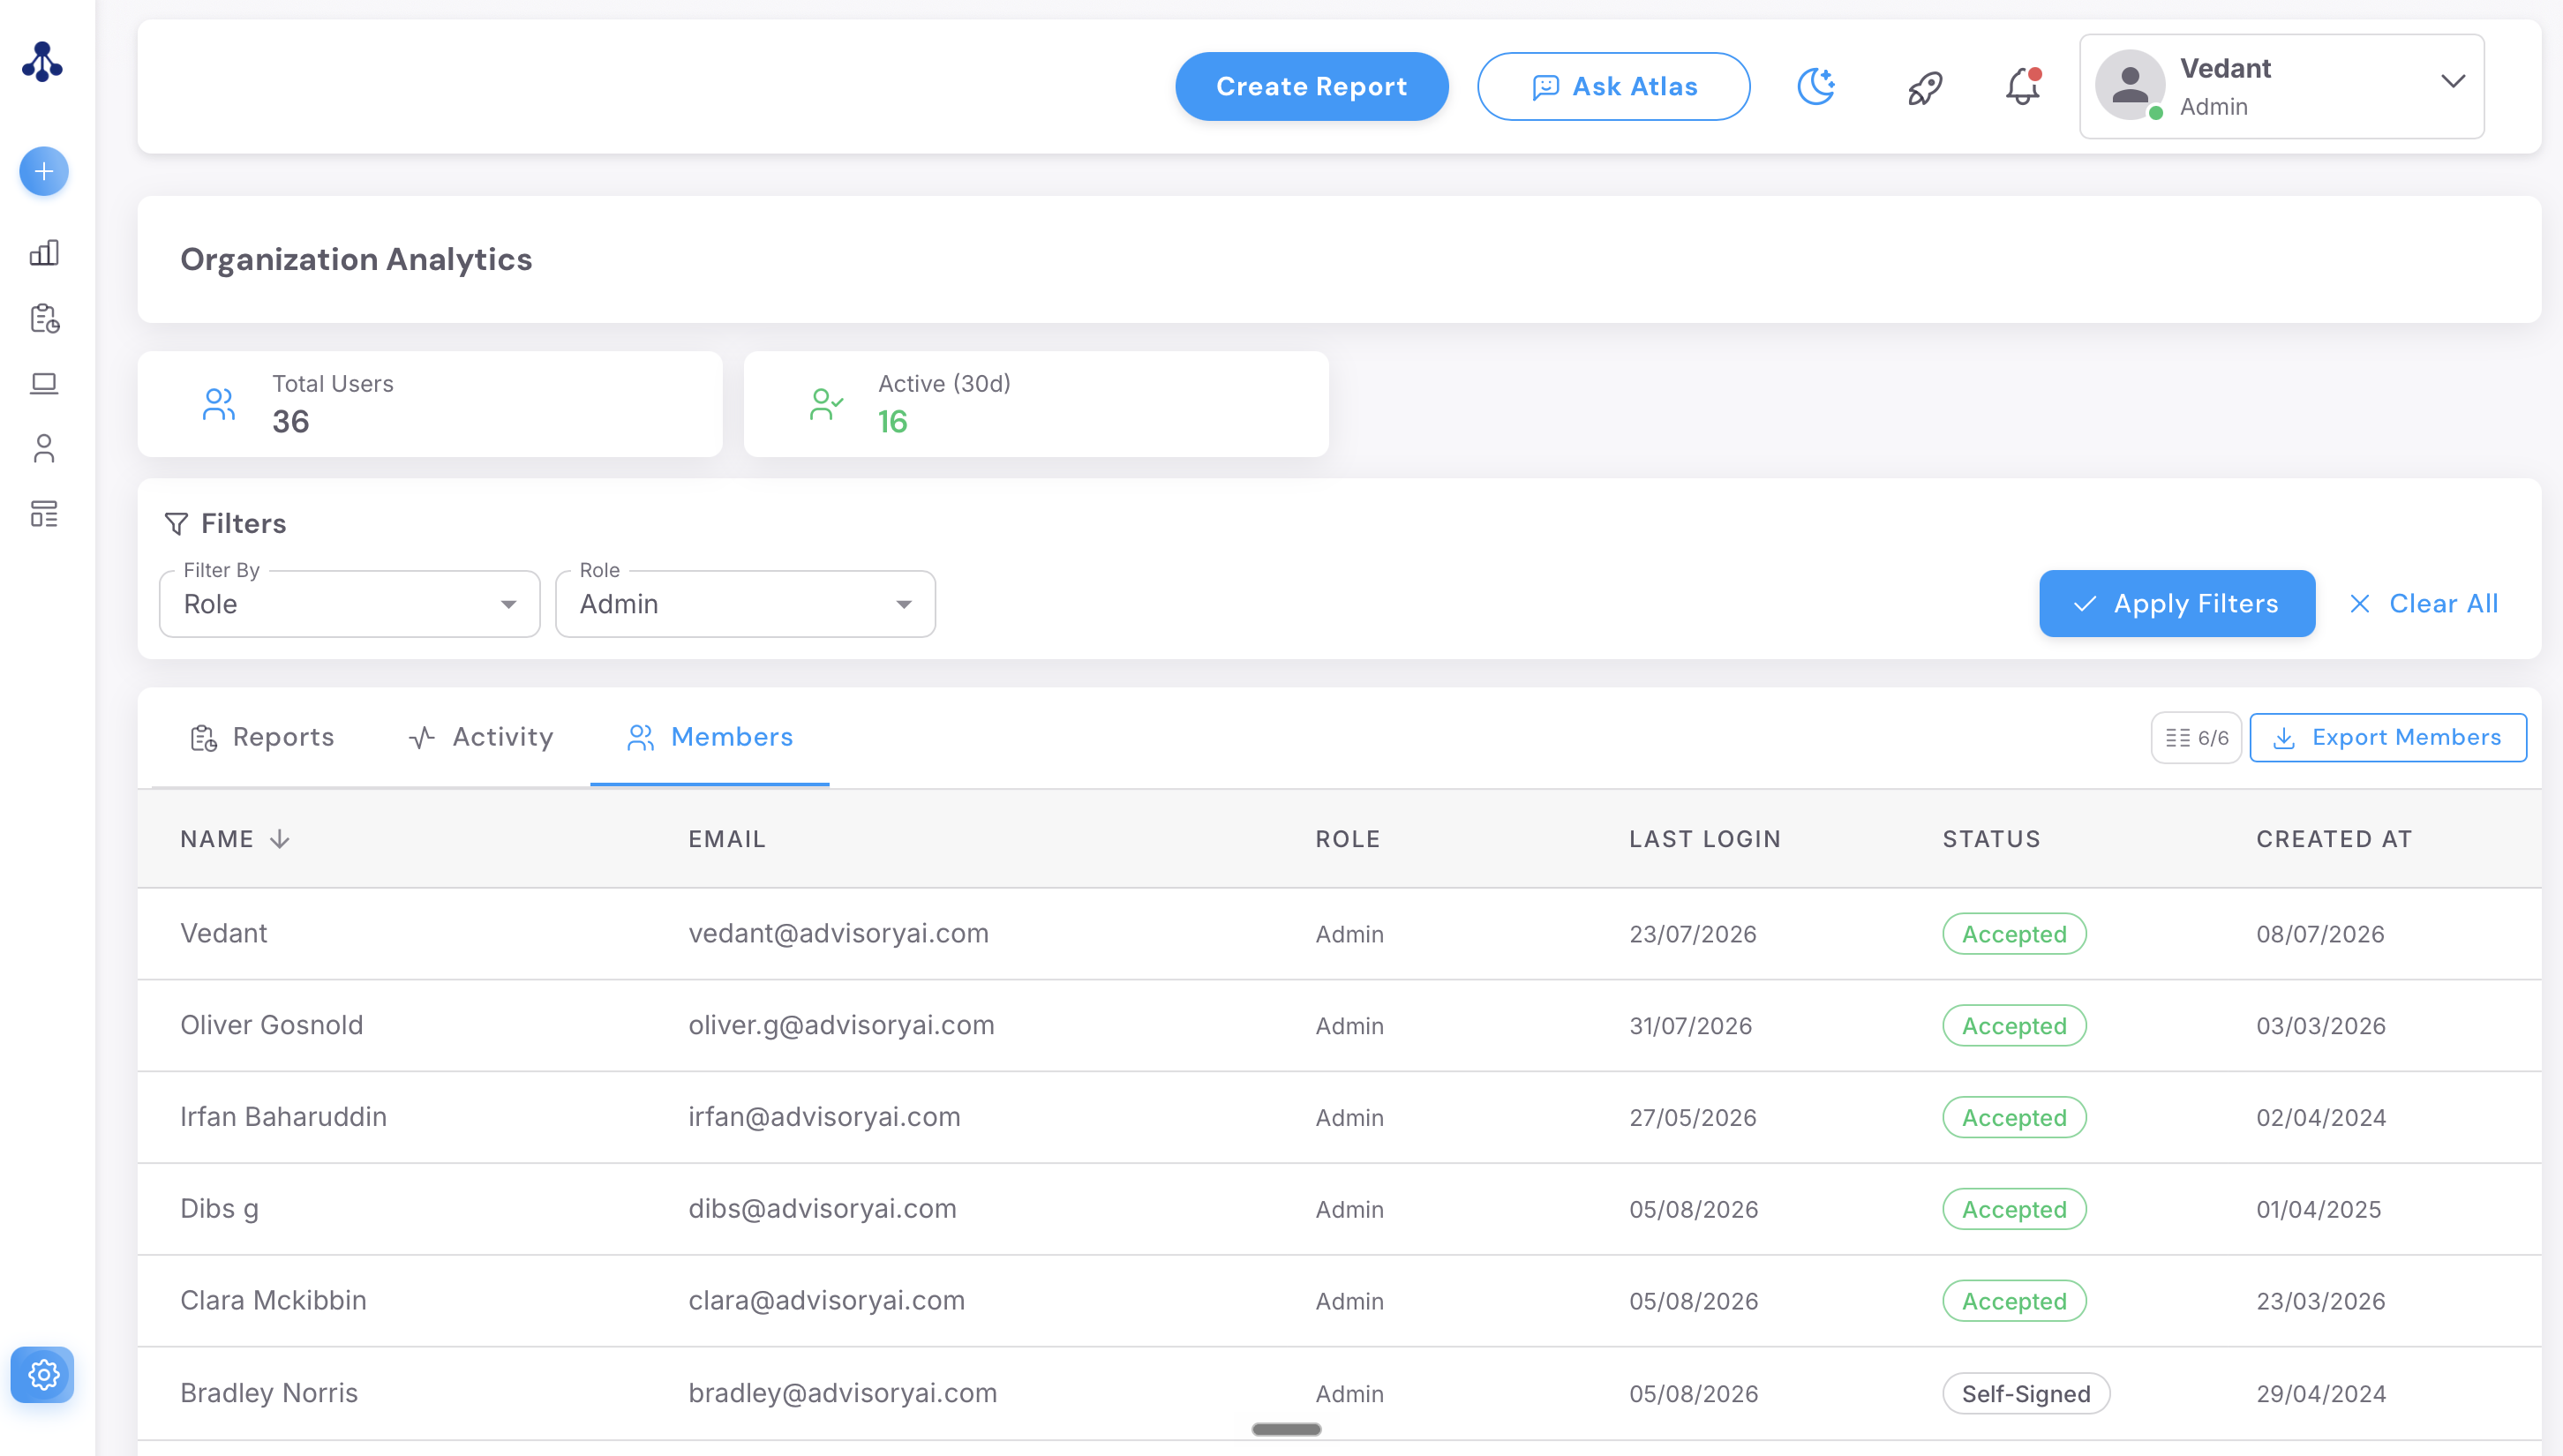
Members
Tells you who's on your team and how engaged they are on the platform.
You can see when the users account was created, and also when their last login was.
Filtering the Data
All three subtabs share the same filtering tools.
Use Filter By to choose how to slice the data — by Role or by Date Created
Use the second dropdown to set the specific value (a role like Admin or Supervisor, or a date range like "This month")
Click Apply Filters to run it, or Clear All to reset
Each table also has a column visibility control, shown as a counter (e.g. "8/10") next to the export button. Click it to choose exactly which columns you want to see, or use Show All and Reset to jump between views quickly.
Exporting
Every subtab can be exported as a CSV file — Export Reports, Export Activity, and Export Members each download just the data from that tab.
In this example, we've exported the Reports tab: applying filters and column visibility first, then clicking Export Reports, gives a confirmation and downloads a CSV of exactly what's on screen.
If You Can't Find This Page
If Organisation Analytics doesn't appear in your settings, double-check you're an Admin or Supervisor — other roles don't have access.