Tracking Usage Across Your Organisation
Last updated: October 12, 2026
This article shows you where to see how your team is using AdvisoryAI, how to filter and export that data, and how to get a usage report the platform does not show.
The Organisation Analytics page gives Admins and Supervisors one place to see activity across the firm, split into three subtabs: Reports, Activity and Members. Keeping an eye on it shows which team members are getting value from the platform and which might need a nudge, lets you track how many meetings advisers have and which report types paraplanners are creating, and surfaces back office integration problems early. A user syncing zero updates when they should be syncing daily is usually the first sign something is wrong.
Before you begin
- You need the Admin or Supervisor role. Other roles do not see Organisation Analytics.
- Decide the period and the people you want to look at, because the filters work the same way on every subtab.
- If you want the data outside the platform, each subtab exports as a CSV, so have a folder ready for the download.
Open Organisation Analytics
- Click the cog icon in the bottom left of the platform.
- Select Tools and Settings.
- Select Organisation.
- Select Organisation Analytics.
Please note: if Organisation Analytics does not appear in your settings, check that you are an Admin or Supervisor. Admins see firm-wide activity here, but the Meetings tab elsewhere in the platform stays personal to each user.
Read the three subtabs
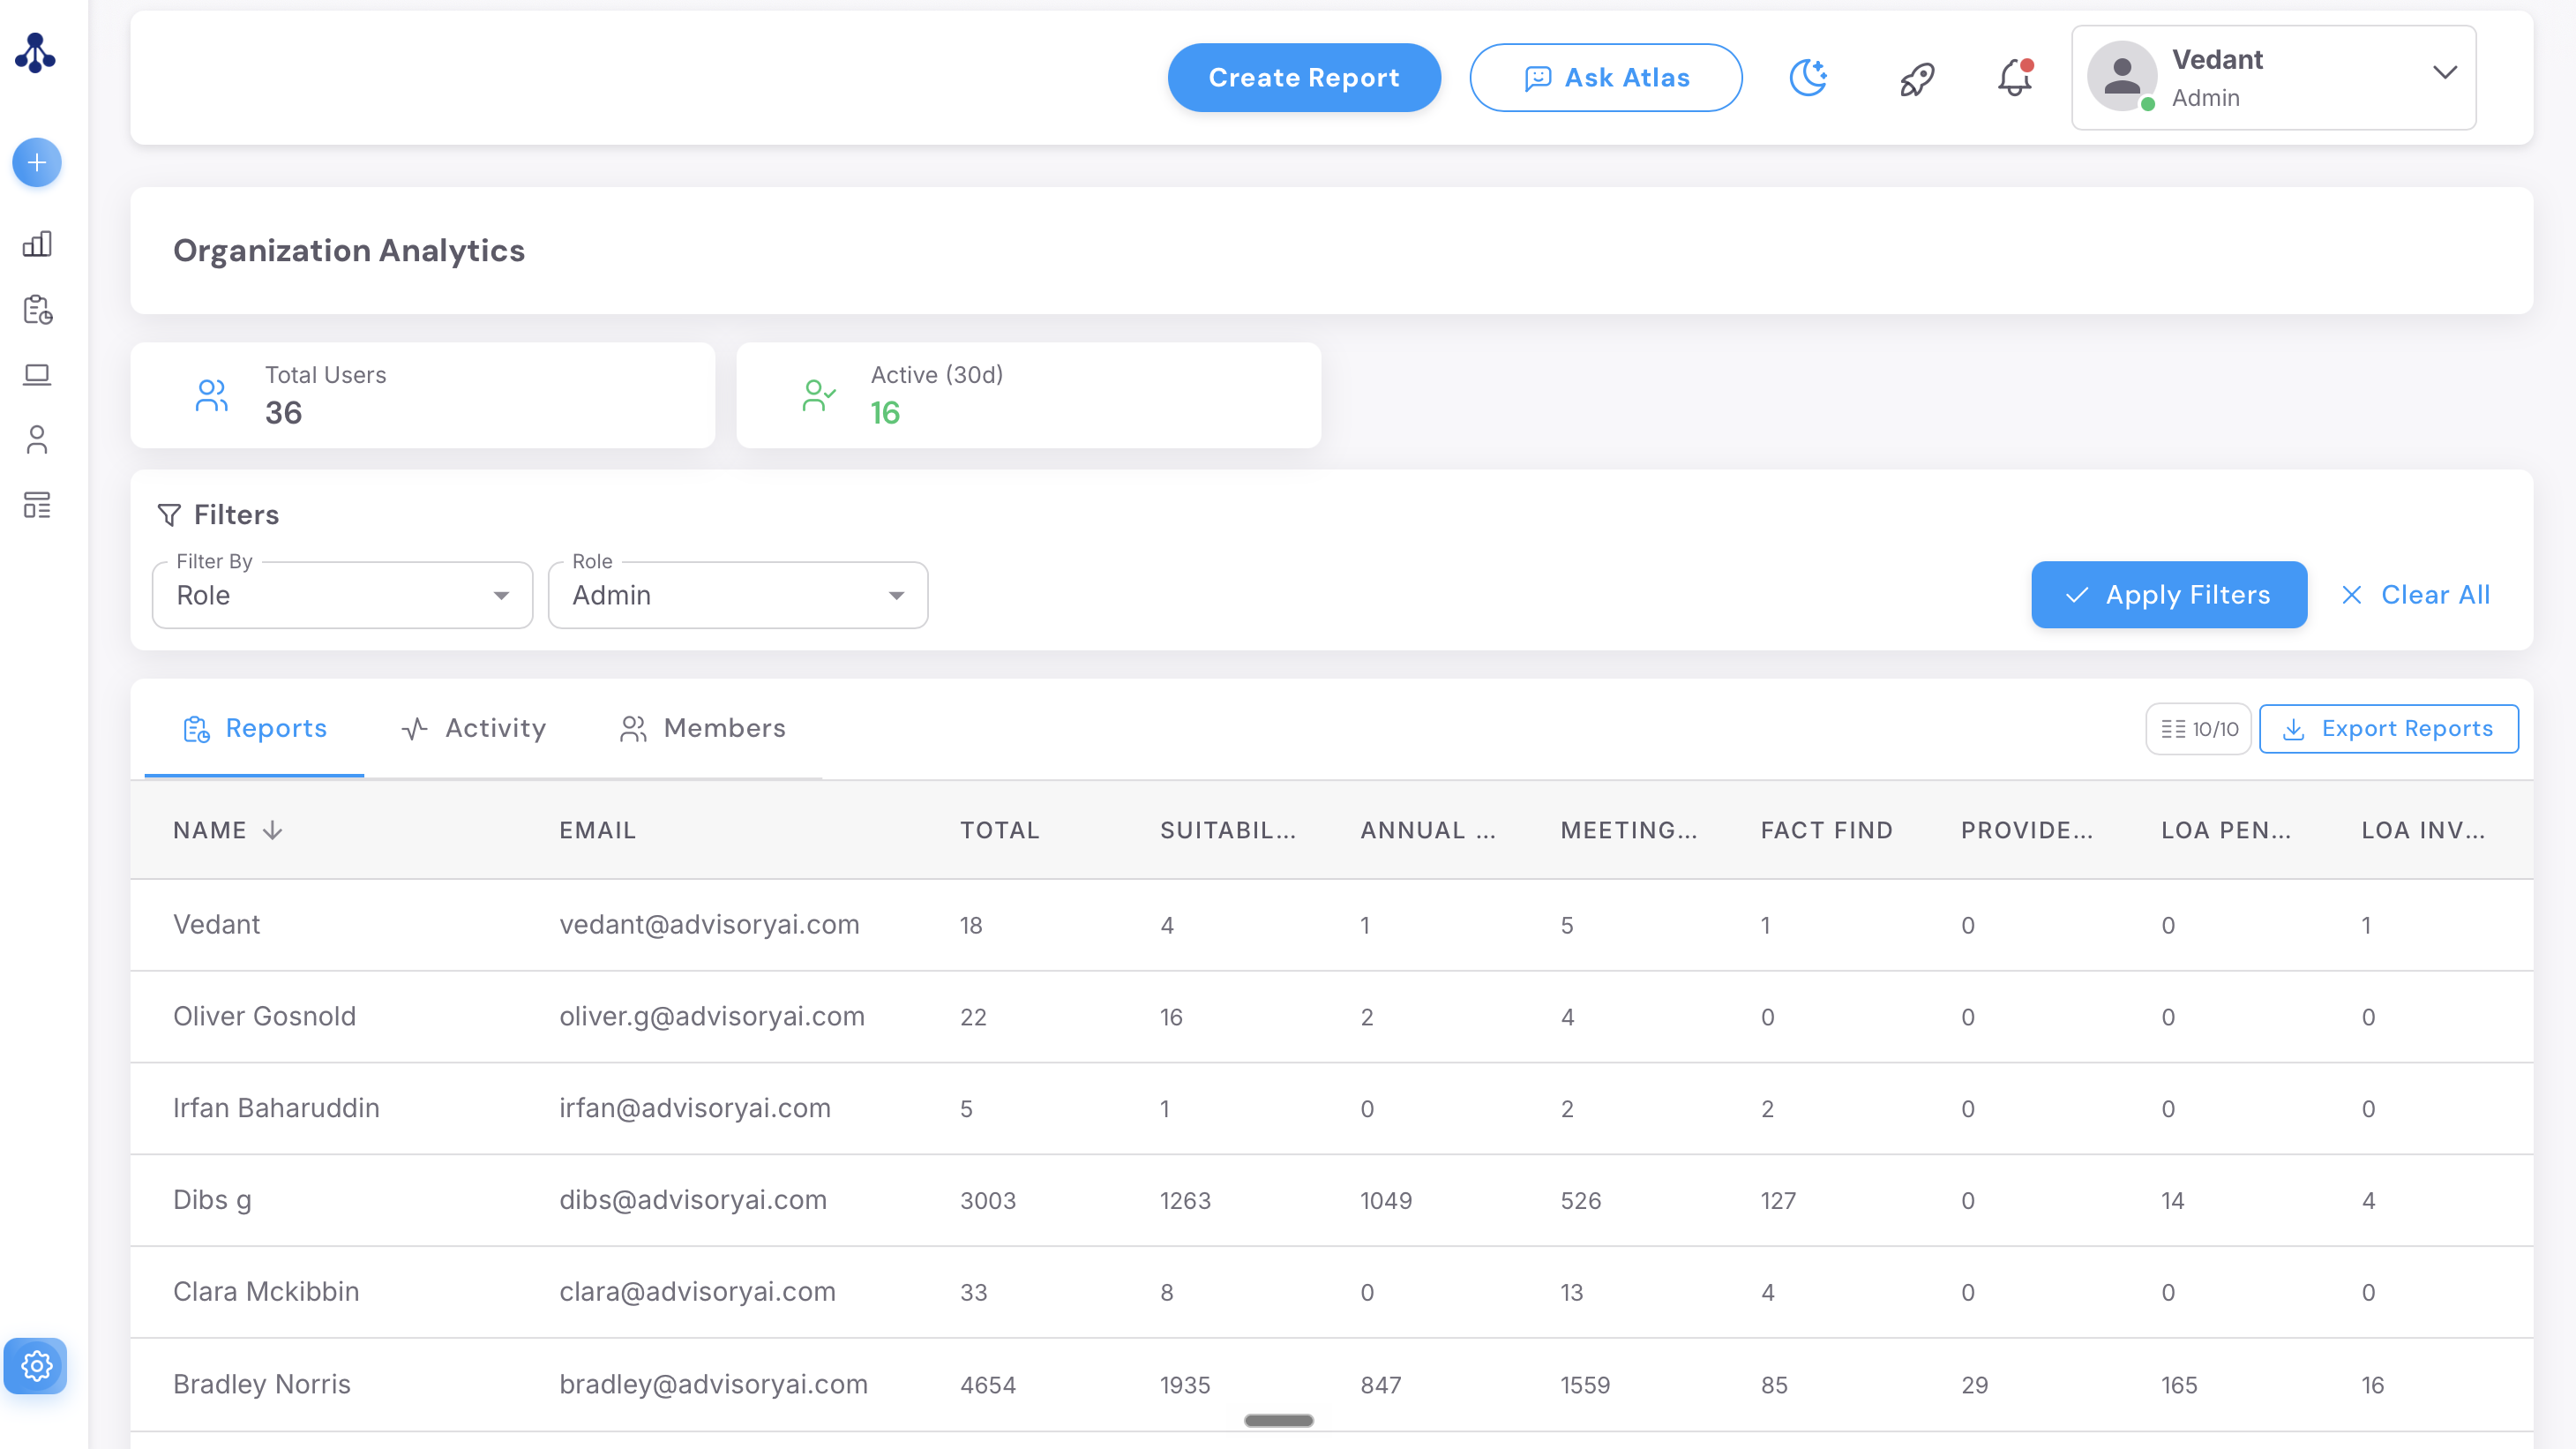
Reports tells you who is producing reports on the platform and what kind.
- Total reports created by each user.
- A breakdown by report type: suitability letters, annual reviews, meeting notes, fact finds, provider information, and LOA summaries by asset class.
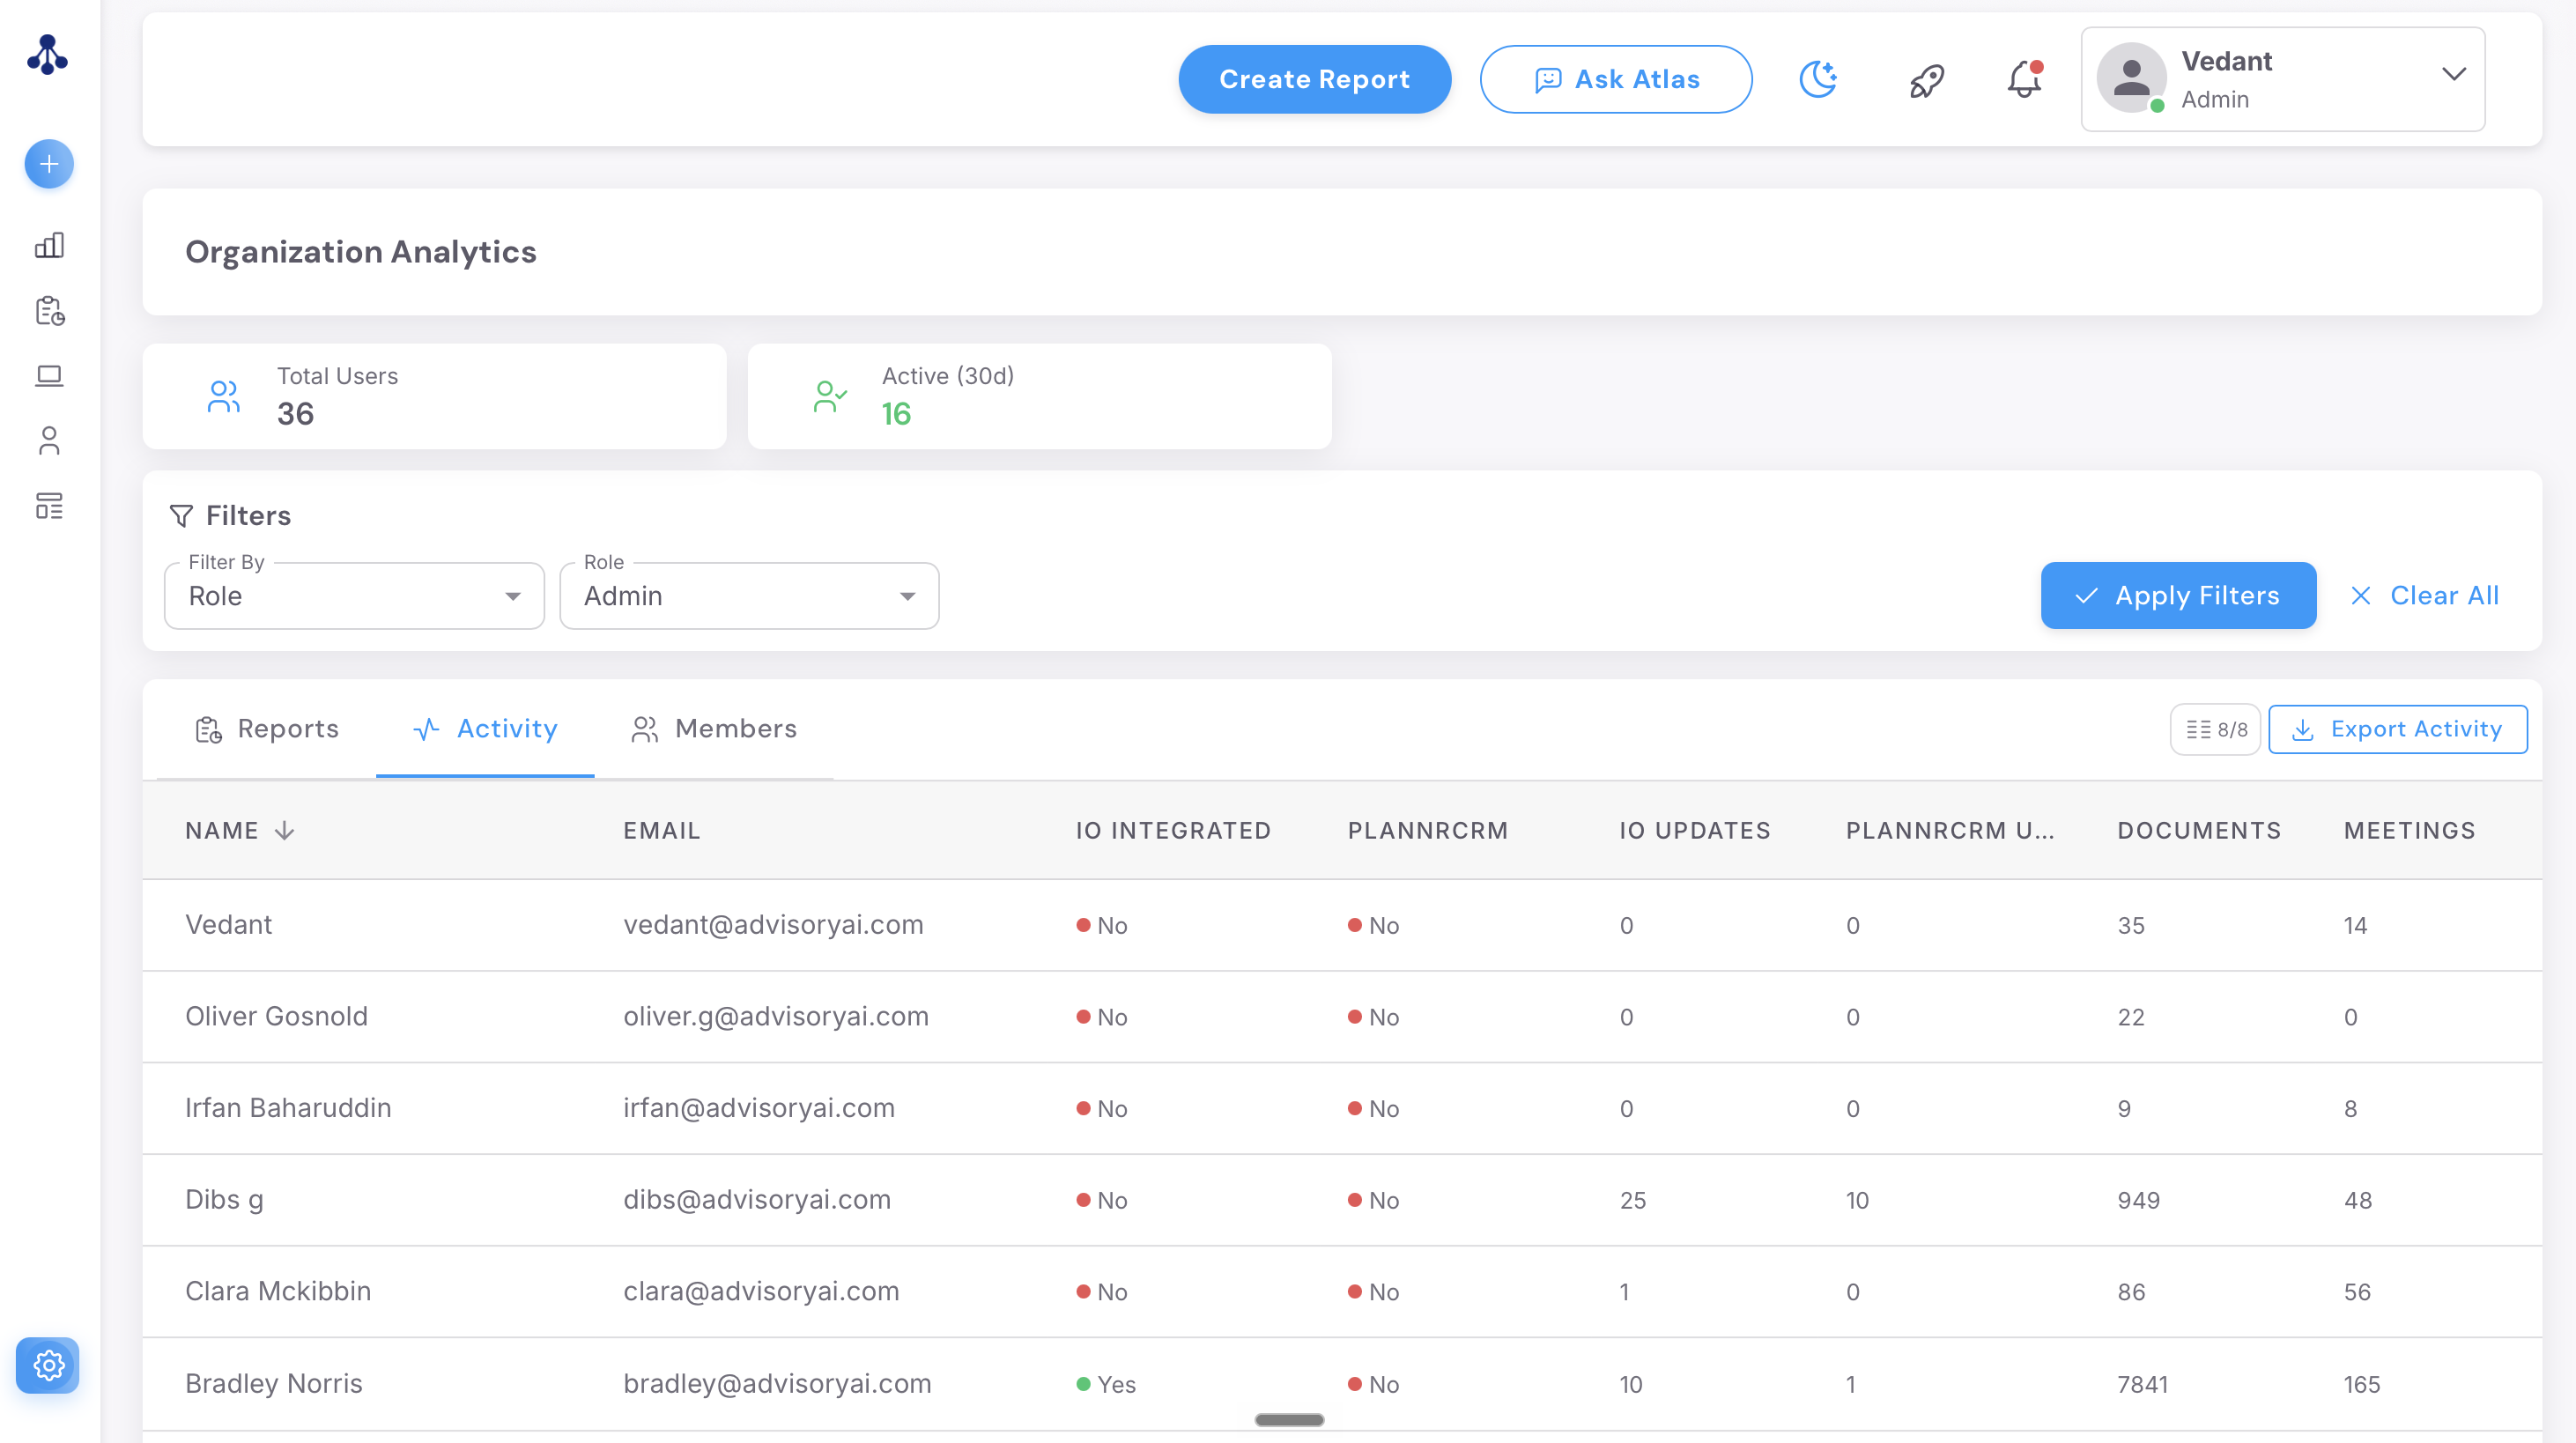
Activity tells you how healthy each user's back office connection is.
- Whether each user is connected to Intelliflo (IO) or PlannrCRM.
- How many updates have synced from each.
- Overall document and meeting counts for each user.
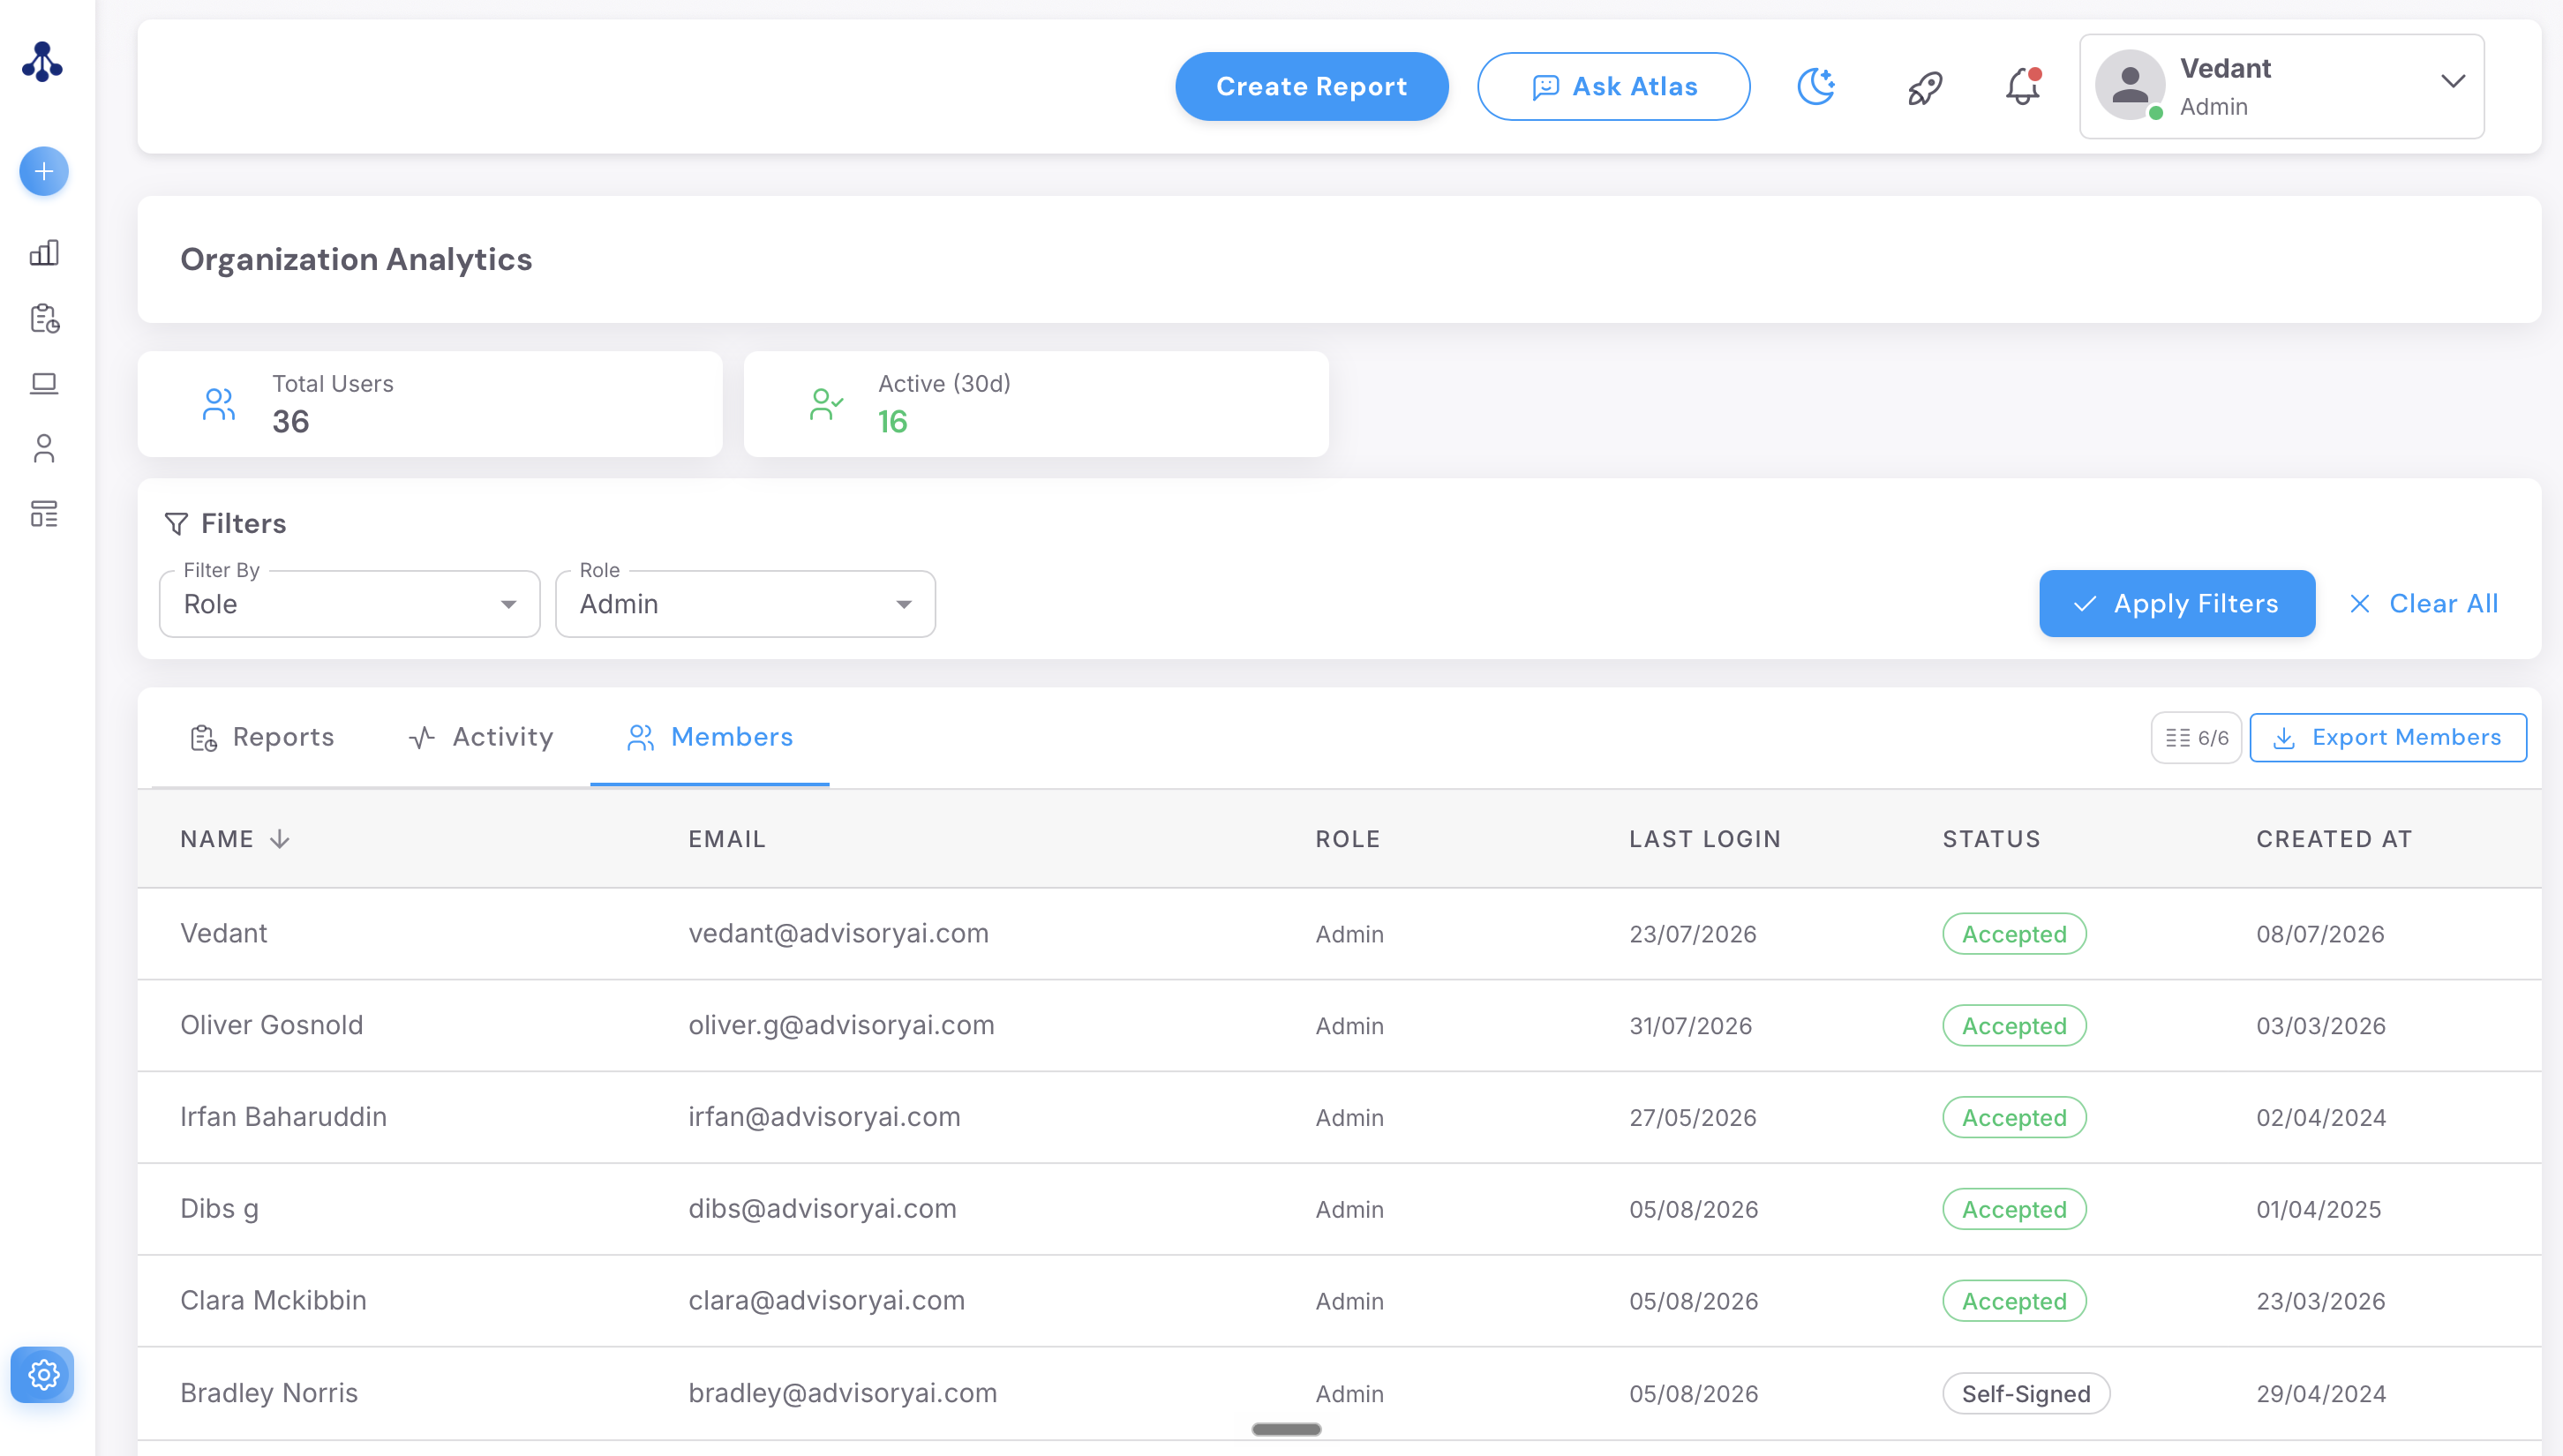
Members tells you who is on your team and how engaged they are. You can see when each user's account was created and when they last logged in.
Filter the data
All three subtabs share the same filtering tools.
- Use Filter By to choose how to slice the data, by Role or by Date Created.
- Use the second dropdown to set the value: a role such as Admin or Supervisor, or a date range such as "This month".
- Click Apply Filters to run it, or Clear All to reset.
Each table also has a column visibility control, shown as a counter such as "8/10" next to the export button. Click it to choose which columns you want to see, or use Show All and Reset to jump between views.
Please note: the home dashboard has its own date range. If the figures do not change after you pick a new range, including "all time", click Apply and they refresh. The client count on that dashboard is the number of clients held on AdvisoryAI, not the number in your back office system.
Export a subtab
- Apply any filters and column choices first, because the export contains exactly what is on screen.
- Click Export Reports, Export Activity or Export Members, depending on the subtab you are on.
- Confirm the export. A CSV of that subtab downloads to your device.
Get a usage report the page does not show
Organisation Analytics is a live, high-level view. For a regular usage report by email, or a historical breakdown by user, licence type, report type and week, email support@advisoryai.com or ask your account manager. The team can send a one-off snapshot for a date range, or set up a weekly send that covers the full previous week.
Please note: the platform does not report on the accuracy of your reports, because AdvisoryAI does not read the content of customer reports. The measures tracked are reruns, uptime and response times. Coaching-style measures such as who spoke most, client engagement or service-level tracking are not in Organisation Analytics; if you need them, email support@advisoryai.com with the measure you want and how you would use it, and the team logs it against the analytics roadmap and replies with whether an on-request report can cover it in the meantime.
See it in action
Select Organisation Analytics
In this example, we've exported the Reports tab: applying filters and column visibility first, then clicking
Also asked
How can we measure how much time the platform is saving per report, so we can justify the spend?
Organisation Analytics does not show time per report today. Time spent on the platform per report, broken down by template, has been requested and is with the developers, with no date to give.
What the page shows now is reports created by each user and by type, meeting and document counts, and sync activity, so the nearest measure today is report volume by template against the time your team used to spend on that report type. If you want the per-report measure, email support@advisoryai.com with the templates you care about and the period; the team adds your firm to the request and sends an interim usage snapshot from the data it holds.
Next steps
- Set a monthly reminder to open the Activity subtab and check for users whose sync count has stopped moving.
- If a user is missing from Members or needs a different role, see the articles below on users and roles.
Related articles
- Licences and Roles Explained
- Adding/Removing users for your organisation
- Accessing Adviser Meetings as a Paraplanner
Ready to check your firm's usage? Open AdvisoryAI, click the cog and go to Tools and Settings, then Organisation.